All of our homology models consist of complete sequences of the N-terminal parts of human beta-cardiac myosin heavy chain, with human ventricular cardiac myosin regulatory (RLC) and essential (ELC) light chains attached. They have all been energy minimized using the YASARA force field (ref 1). They can be downloaded below. We hope you find them useful in your work, and we only ask that if you use these models in your publications or your seminars that you acknowledge their origins from the Spudich laboratory.
1. Krieger E, Joo K, Lee J, Lee J, Raman S, Thompson J, Tyka M, Baker D, Karplus K. Improving physical realism, stereochemistry, and side-chain accuracy in homology modeling: Four approaches that performed well in CASP8. Proteins. 2009;77 Suppl 9:114-22.
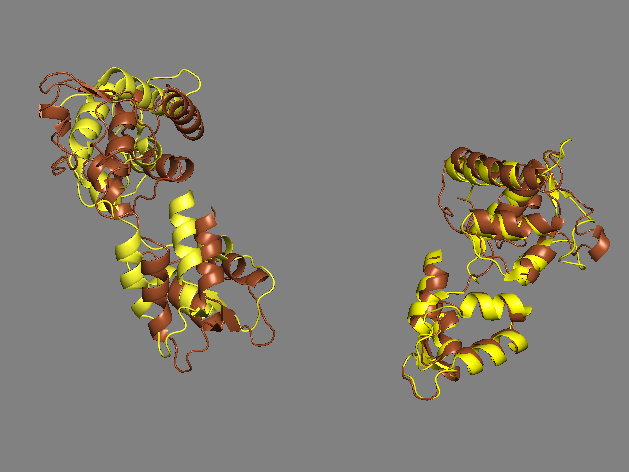
Human beta-cardiac myosin S1 in its pre-stroke and post-stroke states
We have created homology models of human beta-cardiac myosin S1 in pre-stroke and post-stroke states, which can be downloaded below. Both models receive a good evaluation score by the evaluation metrics described at
https://www.rbvi.ucsf.edu/chimera/docs/UsersGuide/modbase.html
![The models were evaluated using ModEval [1] methodology. Evaluation metrics are tabulated for the two models that were developed. The TSVMod predicted Cα root-mean-square deviation (RMSD) shows the Cα-RMSD of the model from the template structure an…](https://images.squarespace-cdn.com/content/v1/55cbcdf4e4b0fe0a5d68c8fa/1498061449605-XRGKKX1WF2APO0DJBOCD/prestroke+poststroke+eval+metrics.jpeg)
The models were evaluated using ModEval [1] methodology. Evaluation metrics are tabulated for the two models that were developed. The TSVMod predicted Cα root-mean-square deviation (RMSD) shows the Cα-RMSD of the model from the template structure and predicted native overlap provides the fraction of Cα atoms in the model within 3.5 Å of the corresponding atoms in the template structure after rigid-body superposition [2]. zDOPE is a normalized Discrete Optimized Protein Energy (DOPE), an atomic distance-dependent statistical score. Negative values indicate better models [3]. GA341 model score is derived from residue-level statistical potential that was optimized, including distance-dependent, contact, Phi/Psi dihedral angle, and accessible surface statistical potentials. A value > 0.7 generally indicates a reliable model, defined as ≥ 95% probability of correct fold [4].
1. Pieper U et al, ModBase, a database of annotated comparative protein structure models, and associated resources. Nucleic Acids Res (2011).
2. Eramian et al, How well can the accuracy of comparative protein structure models be predicted? Protein Sci (2008).
3. Shen MY et al, Statistical potential for assessment and prediction of protein structures. Protein Sci (2006)
4. Melo F et al, Statistical potentials for fold assessment. Protein Sci (2002).
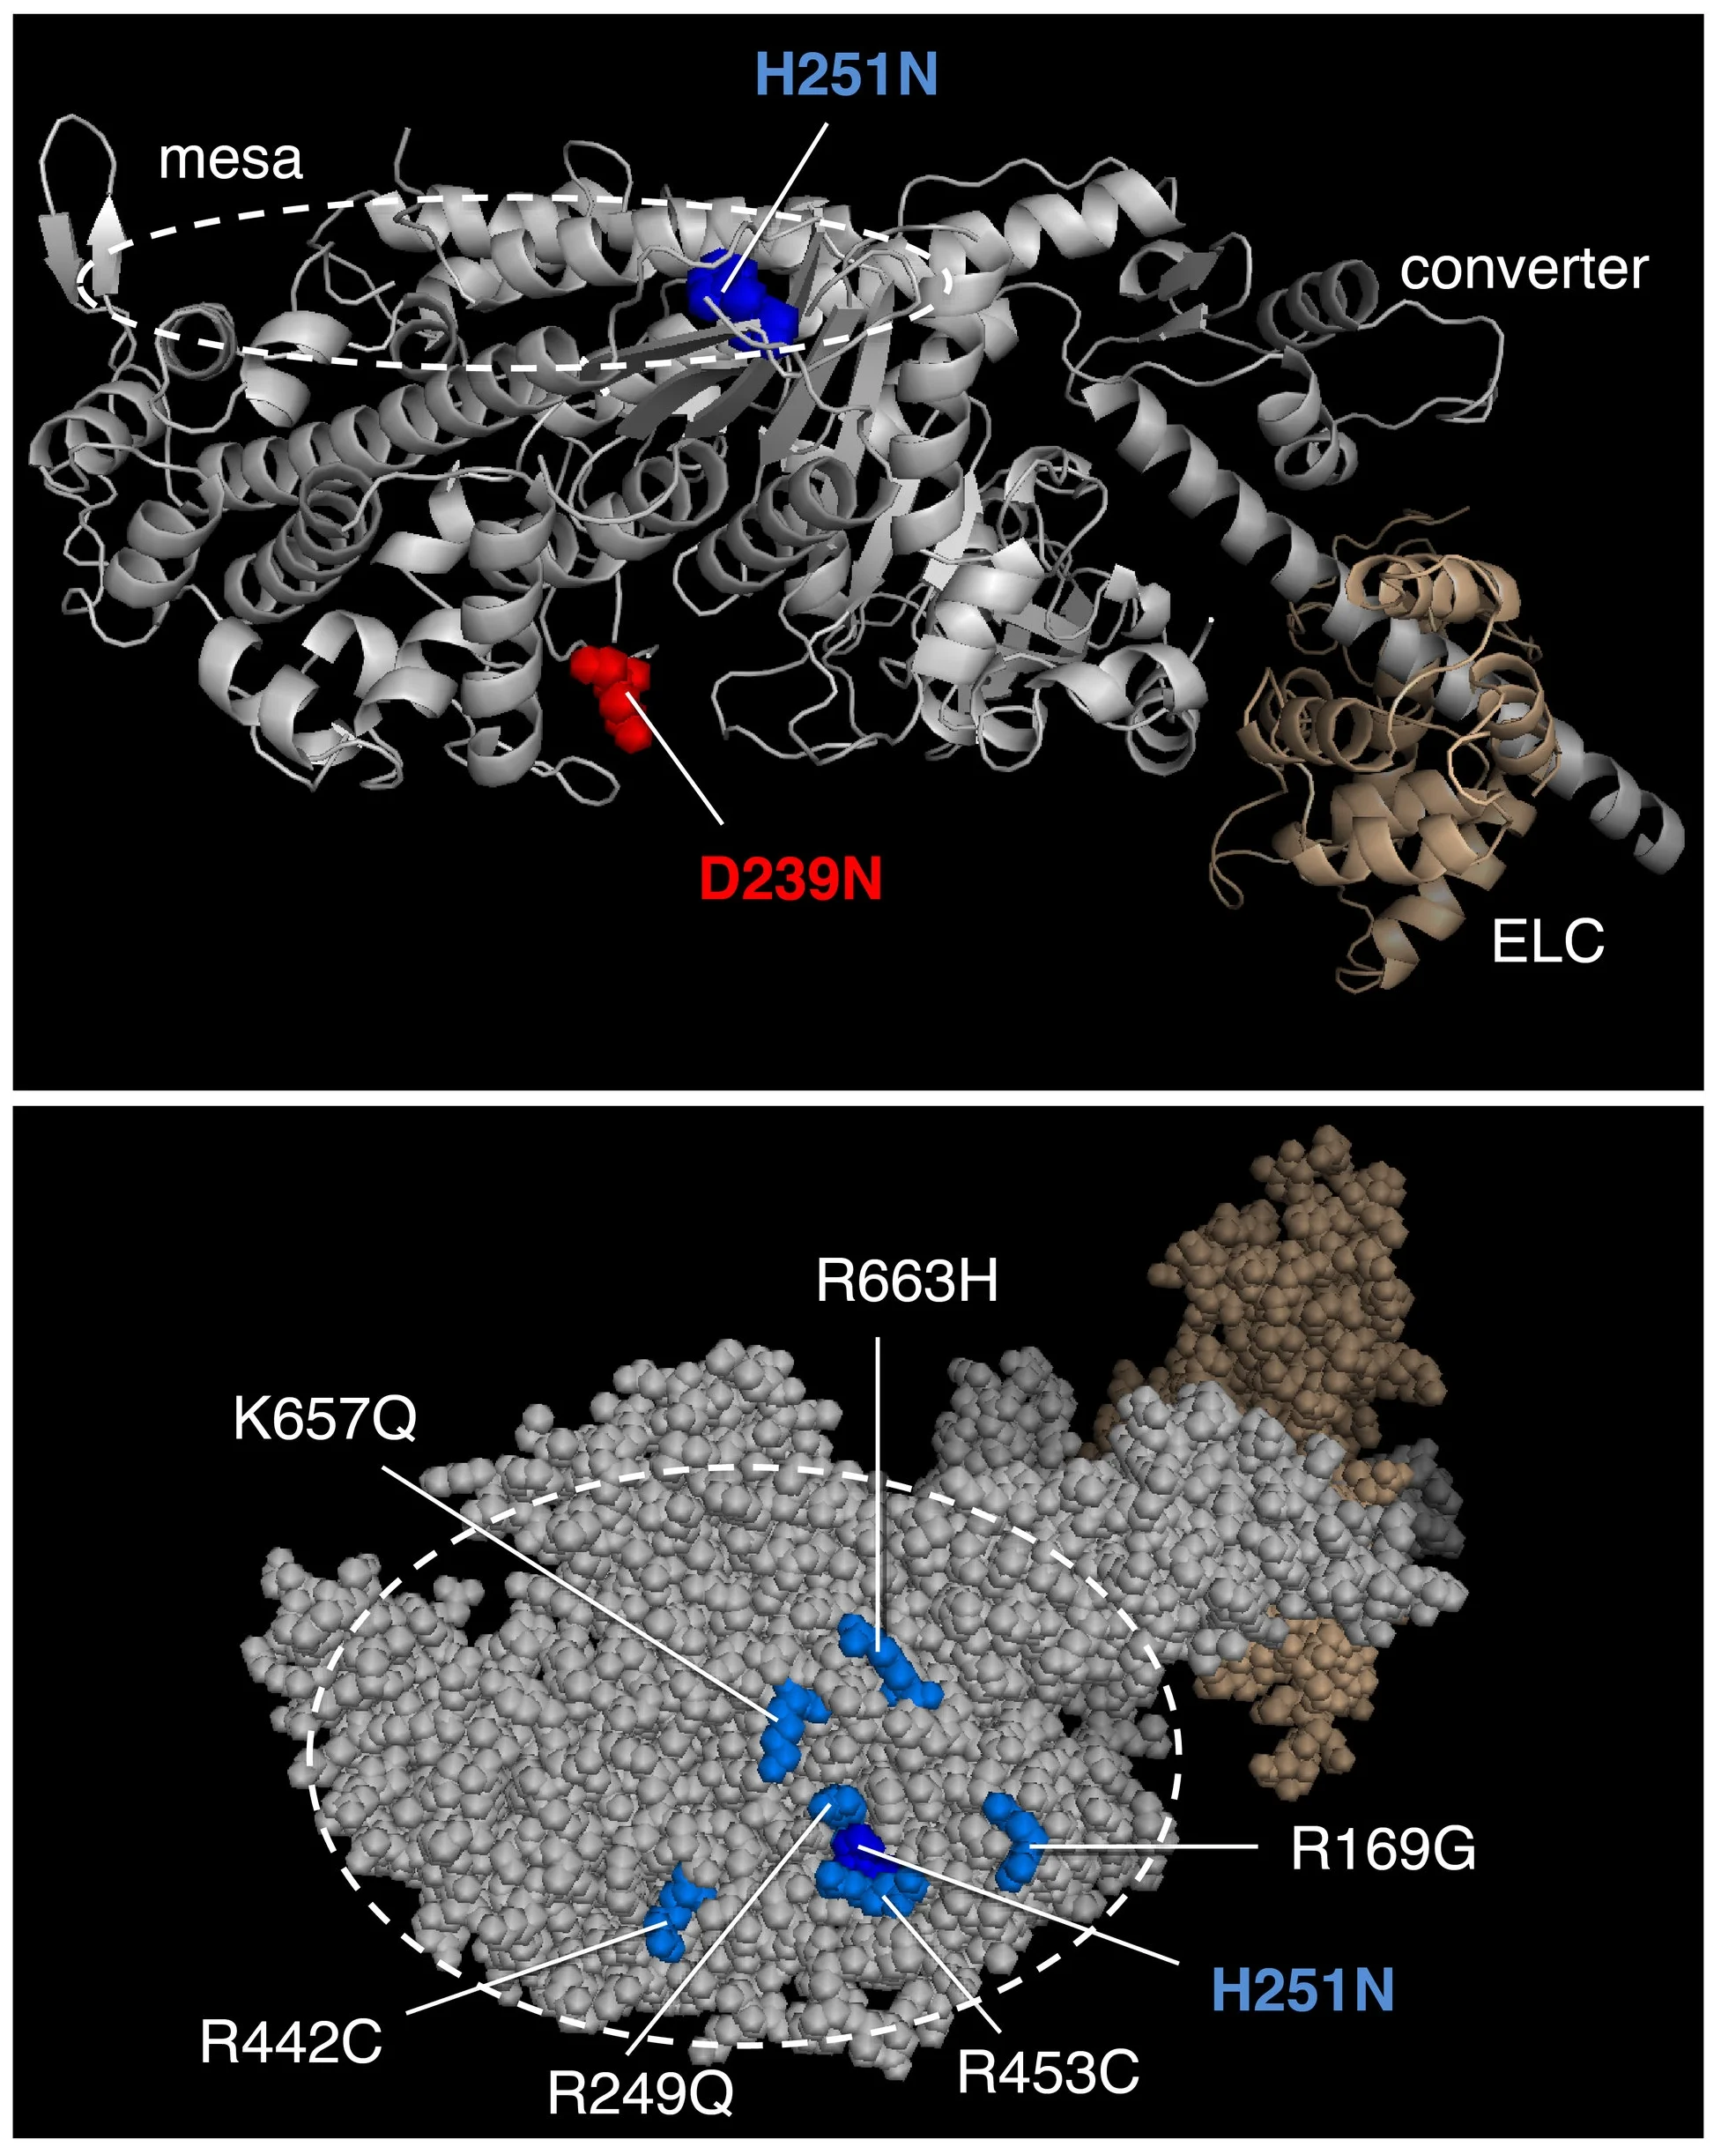
The first homology model of full-length human beta-cardiac myosin S1 was described in Spudich, J.A. (2015). The myosin mesa and a possible unifying hypothesis for the molecular basis of human hypertrophic cardiomyopathy. Biochem Soc Trans. 43:64–72. Also see, Homburger, J.R. et al. Multidimensional structure-function relationships in human β-cardiac myosin from population-scale genetic variation. Proc Natl Acad Sci USA 113, 6701–6706 (2016). Image from Adhikari, A.S., Kooiker, K.B., Sarkar, S.S., Liu, C., Bernstein, D., Spudich, J.A. and Ruppel, K.M. (2016). Early Onset HCM Mutations H251N and D239N Significantly Increase the Velocity, Force, and Actin-activated ATPase activity of human β-cardiac Myosin. Cell Rep. 17:2857-2864.
Descriptions of these homology models and how they were made:
Homology modeling of the human beta-cardiac myosin S1 structures were as described in ref 1. The prestroke structure was performed with template structures of the smooth muscle myosin motor domain (ref 2) (PDB ID code 1BR1, with MgADP.AlF4 bound at the active site, which is thought to mimic most closely the ADP.Pibound state, or prestroke state, of the myosin) and the scallop smooth muscle myosin light chain domain (ref 3) (PDB ID code 3TS5). The templates used for the modeling of the poststroke structure were obtained from the human β-cardiac myosin motor domain crystal structure by Winkelmann and colleagues (ref 4,5) (PDB ID code 4P7H, no nucleotide in the active site) and the rigor structure from the squid myosin motor domain (ref 6) (PDB ID code 3I5G, no nucleotide in the active site). Missing regions in the myosin motor domain (loop1, loop2) were each separately built using the ModLoop program (ref 7)), and regions in the regulatory light chains that were not solved in the crystal structures were independently modeled using the I-TASSER prediction method (ref 8), and they were used as individual templates. Sequence alignment between MYH7, MLC1, and MLC2 with their respective structural templates was obtained. The models of prestroke and poststroke structures were acquired using the MODELER package (ref 9). We used a multitemplate modeling method: A total of 100 models were obtained, and the best model was selected based on the discrete optimized protein energy score. The structural models were energy-minimized using SYBYL7.2 (Tripos, Inc.) to remove potential short contacts. The final 3D models of the prestroke and poststroke structures were validated using RAMPAGE (ref 10), which provides a detailed check on the stereochemistry of the protein structure using the Ramachandran map. They were also energy minimized using the YASARA force field (ref 11). Visualizations were performed using PyMOL (www. pymol.org).
- Homburger JR et al. Multidimensional structure-function relationships in human β-cardiac myosin from population-scale genetic variation. Proc Natl Acad Sci USA 113, 6701–6706 (2016).
- Dominguez R, Freyzon Y, Trybus KM, Cohen C. Crystal structure of a vertebrate smooth muscle myosin motor domain and its complex with the essential light chain: visualization of the pre-power stroke state. Cell 94:559–571 (1998).
- Kumar VSS, et al. Crystal structure of a phosphorylated light chain domain of scallop smooth-muscle myosin. Biophys J 101:2185–2189 (2011).
- Winkelmann DA, Miller MT, Stock AM, Liu L. Structure of Human beta-Cardiac Myosin Motor Domain at 3.2 A. Mol Biol Cell 22:4705 (2011).
- Winkelmann DA et al. Structural basis for drug-induced allosteric changes to human β-cardiac myosin motor activity. Nat Commun 6, 7974 (2015).
- Yang Y, et al. Rigor-like structures from muscle myosins reveal key mechanical elements in the transduction pathways of this allosteric motor. Structure 15:553–564 (2007).
- Fiser A, Sali A. ModLoop: Automated modeling of loops in protein structures. Bioinformatics 19:2500–2501 (2003).
- Yang J, et al. The I-TASSER Suite: Protein structure and function prediction. Nat Methods 12:7–8 (2015).
- Sali A, Blundell TL. Comparative protein modelling by satisfaction of spatial restraints. J Mol Biol 234:779–815 (1993).
- Lovell SC, et al. Structure validation by Calpha geometry: Phi,psi and Cbeta deviation. Proteins 50:437–450 (2003).
- Krieger E, Joo K, Lee J, Lee J, Raman S, Thompson J, Tyka M, Baker D, Karplus K. Improving physical realism, stereochemistry, and side-chain accuracy in homology modeling: Four approaches that performed well in CASP8. Proteins. 2009;77 Suppl 9:114-22.
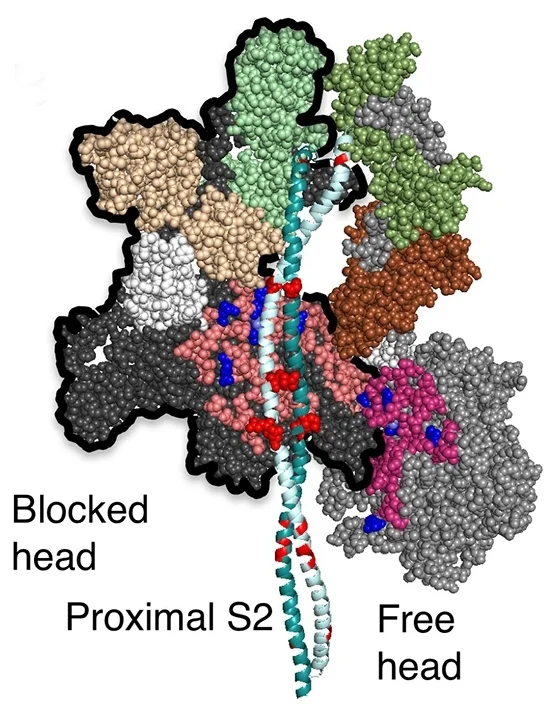
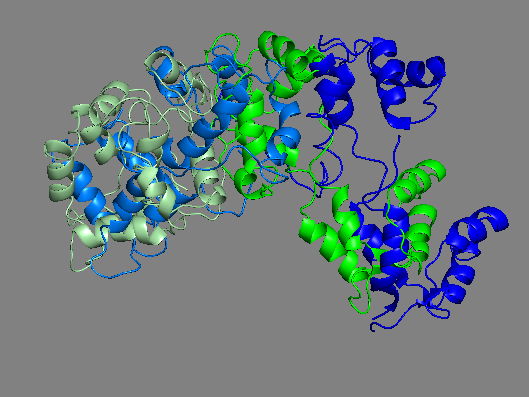
Human beta-cardiac myosin with its heads folded back onto its own S2 tail
Our homology models of human beta-cardiac myosin with its heads folded back onto its own S2 tail can be downloaded below. Such folded-back structures have been referred to in publications by others as the interacting-heads motif (IHM) since there are interactions between the heads in addition to interactions between the heads and S2.
We have created three homology models of human beta-cardiac myosin with their heads folded back onto their own S2 tail, MS01, MS02 and MS03, all of which are very similar to one another and are all consistent with the conclusions and considerations discussed in our 2016 and 2017 publications. All three models receive a good evaluation score by the evaluation metrics described at
https://www.rbvi.ucsf.edu/chimera/docs/UsersGuide/modbase.html
MS01: A complete folded-back model of human beta-cardiac myosin with human cardiac light chains.
The first homology model of the human beta-cardiac myosin in its folded back off-state (IHM motif) was described in Adhikari, A.S., Kooiker, K.B., Sarkar, S.S., Liu, C., Bernstein, D., Spudich, J.A. and Ruppel, K.M. (2016). Early Onset HCM Mutations H251N and D239N Significantly Increase the Velocity, Force, and Actin-activated ATPase activity of human β-cardiac Myosin. Cell Rep. 17:2857-2864. Image from Nag, S., Trivedi, D.V., Sarkar, S.S., Adhikari, A.S., Sunitha, M.S., Sutton, S., Ruppel, K.M. and Spudich, J.A. The myosin mesa and the basis of hypercontractility caused by hypertrophic cardiomyopathy mutations. Nat. Struct. Mol. Biol., Advance Online Publication. DOI: 10.1038/nsmb.3408 (2017).
![The models were evaluated using ModEval [1] methodology. Evaluation metrics are tabulated for the three models that were developed. The TSVMod predicted Cα root-mean-square deviation (RMSD) shows the Cα-RMSD of the model from the template structure …](https://images.squarespace-cdn.com/content/v1/55cbcdf4e4b0fe0a5d68c8fa/1497558164023-DDREY887ET52K4DM9JKR/image-asset.jpeg)
The models were evaluated using ModEval [1] methodology. Evaluation metrics are tabulated for the three models that were developed. The TSVMod predicted Cα root-mean-square deviation (RMSD) shows the Cα-RMSD of the model from the template structure and predicted native overlap provides the fraction of Cα atoms in the model within 3.5 Å of the corresponding atoms in the template structure after rigid-body superposition [2]. zDOPE is a normalized Discrete Optimized Protein Energy (DOPE), an atomic distance-dependent statistical score. Negative values indicate better models [3]. GA341 model score is derived from residue-level statistical potential that was optimized, including distance-dependent, contact, Phi/Psi dihedral angle, and accessible surface statistical potentials. A value > 0.7 generally indicates a reliable model, defined as ≥ 95% probability of correct fold [4].
1. Pieper U et al, ModBase, a database of annotated comparative protein structure models, and associated resources. Nucleic Acids Res (2011).
2. Eramian et al, How well can the accuracy of comparative protein structure models be predicted? Protein Sci (2008).
3. Shen MY et al, Statistical potential for assessment and prediction of protein structures. Protein Sci (2006)
4. Melo F et al, Statistical potentials for fold assessment. Protein Sci (2002).
MS03 showing the location of a number of Arg residues that cause HCM when mutated.
Descriptions of these homology models and how they were made:
Our MS01 folded-back human beta-cardiac complete sequence model is described in Nag et al. (ref 1). It was built by Dr. Margaret Sunitha using the PDB 3DTP tarantula skeletal myosin heavy chain 2-nm resolution EM-reconstructed folded-back structure of Alamo et al. (ref 2) as template, and the human cardiac ventricular light chains that were modeled by Dr. Sunitha earlier (ref 3) were aligned to the light chains of the tarantula template structure to obtain the full model. The modeling protocol is described in Nag et al. (ref 1).
- Nag S, Trivedi DV et al. The myosin mesa and the basis of hypercontractility caused by hypertrophic cardiomyopathy mutations. Nat Struct Mol Biol, Advance Online Publication. DOI: 10.1038/nsmb.3408 (2017).
- Alamo L et al. Three-dimensional reconstruction of tarantula myosin filaments suggests how phosphorylation may regulate myosin activity. J Mol Biol 384, 780–797 (2008).
- Homburger JR et al. Multidimensional structure-function relationships in human beta-cardiac myosin from population-scale genetic variation. Proc Natl Acad Sci USA 113, 6701–6706 (2016).
Our MS02 folded-back human beta-cardiac complete sequence model was built by Dr. Margaret Sunitha using the PDB 3DTP tarantula skeletal myosin heavy chain 2-nm resolution EM reconstructed folded-back structure of Alamo et al. (ref 1) as template using both the heavy and the light chains, and the human cardiac ventricular light chains that were modeled earlier (ref 2) were used as additional templates to minimize steric clashes. The modeling protocol was similar to Homburger, J.R. et al. (ref 2). While the MS01 and MS02 models are the same with respect to all of the conclusions and considerations discussed in our recent papers (refs 3-5), the MS02 version eliminates minor steric clashes between the LCs and the blocked-head heavy chain that occur in MS01.
1. Alamo, L et al. Three-dimensional reconstruction of tarantula myosin filaments suggests how phosphorylation may regulate myosin activity. J Mol Biol 384, 780–797 (2008). 2. Homburger, JR et al. Multidimensional structure-function relationships in human beta-cardiac myosin from population-scale genetic variation. Proc Natl Acad Sci USA 113, 6701–6706 (2016). 3. Adhikari, AS et al. Early-onset cardiomyopathy mutations significantly increase the velocity, force and actin-activated ATPase activity of human beta-cardiac myosin. Cell Rep 17, 2857-2864 (2016). 4. Kawana, M et al. Biophysical properties of human beta-cardiac myosin with converter mutations that cause hypertrophic cardiomyopathy. Sci Adv 3, e1601959 (2017). 5. Nag, S, Trivedi, DV et al. The myosin mesa and the basis of hypercontractility caused by hypertrophic cardiomyopathy mutations. Nat Struct Mol Biol, Advance Online Publication. DOI: 10.1038/nsmb.3408 (2017).
Our MS03 folded-back human beta-cardiac complete sequence model was built by Dr. Margaret Sunitha using the PDB 3JBH tarantula skeletal myosin heavy chain 2-nm resolution EM reconstructed folded-back structure of Alamo et al. (ref 1) as template using both the heavy and the light chains, and the human cardiac ventricular light chains that were modeled earlier (ref 2) were used as additional templates. The modeling protocol was similar to Homburger, JR et al. (ref 2). The MS01, MS02 and MS03 models are the same with respect to all of the conclusions and considerations discussed in our recent papers (refs 3-5).
1. Alamo L et al. Conserved intramolecular interactions maintain myosin interacting-heads motifs explaining tarantula muscle super-relaxed state structural basis. J Mol Biol 428, 1142-1164 (2016). 2. Homburger JR et al. Multidimensional structure-function relationships in human beta-cardiac myosin from population-scale genetic variation. Proc Natl Acad Sci USA 113, 6701–6706 (2016). 3. Adhikari AS et al. Early-onset cardiomyopathy mutations significantly increase the velocity, force and actin-activated ATPase activity of human beta-cardiac myosin. Cell Rep. 17, 2857-2864 (2016). 4. Kawana M et al. Biophysical properties of human beta-cardiac myosin with converter mutations that cause hypertrophic cardiomyopathy. Sci Adv 3, e1601959 (2017). 5. Nag S, Trivedi DV et al. The myosin mesa and the basis of hypercontractility caused by hypertrophic cardiomyopathy mutations. Nat Struct Mol Biol, Advance Online Publication. DOI: 10.1038/nsmb.3408 (2017).
Human beta-cardiac myosin with its heads folded back onto its own S2 tail and bound to myosin binding protein-C (MyBP-C)
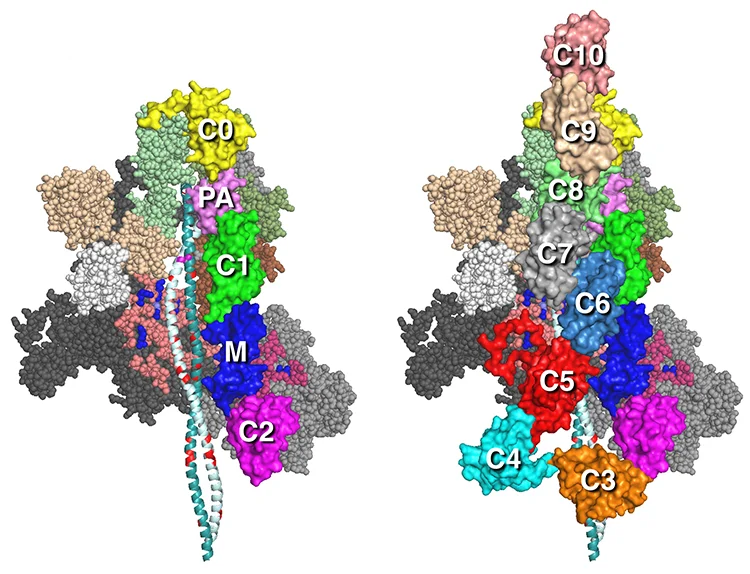
MS01C0C2 MS01C0C10
Our MS01C0C2 and MS01C0C10 folded-back human beta-cardiac complete sequence models with the C0-C2 N-terminal fragment of myosin binding protein-C (MyBP-C) or full length (C0-C10 domains) MyBP-C bound to the MS01 folded back myosin structure are described in Nag et al. (ref 1).
1. Nag, S., Trivedi, D.V. et al. The myosin mesa and the basis of hypercontractility caused by hypertrophic cardiomyopathy mutations. Nat. Struct. Mol. Biol., Advance Online Publication. DOI: 10.1038/nsmb.3408 (2017).
Our MS03C0C2, Ms03C0C10v2, and MS03C0C10v3 folded back models show different possible orientations of the MyBP-C domains. Our best working hypothesis is MS03C0C10v3 since it is not only consistent with biochemical binding data of Gautel and colleagues (refs 1,2) and Nag et al. (ref 3), but also fits best with structural data from antibody mapping of MyBP-C domains along the sarcomere (ref 4) and EM reconstructions from human cardiac thick filaments (ref 5).
- Gruen M, Gautel M. Mutations in beta-myosin S2 that cause familial hypertrophic cardiomyopathy (FHC) abolish the interaction with the regulatory domain of myosin-binding protein-C. J Mol Biol 286:933-949 (1999).
- Ratti J, Rostkova E, Gautel M, Pfuhl M. Structure and interactions of myosin-binding protein C domain C0: cardiac-specific regulation of myosin at its neck? J Biol Chem 286:12650-12658 (2011).
- Nag S, Trivedi DV et al. The myosin mesa and the basis of hypercontractility caused by hypertrophic cardiomyopathy mutations. Nat Struct Mol Biol, Advance Online Publication. DOI: 10.1038/nsmb.3408 (2017).
- Lee K, Harris S., Sadayappan S, Craig R. Orientation of myosin binding protein C in the cardiac muscle sarcomere determined by domain-specific immuno-EM. J Mol Biol 427, 274-286 (2015).
- Al-Khayat HA, Kensler RW, Squire JM, Marston SB, Morris EP. Atomic model of the human cardiac muscle myosin filament Proc Natl Acad Sci U S A 110:318-323 (2013).
All these MyBP-C models are hypothetical structures based on known biochemical interactions of MyBP-C with myosin and other structural considerations and serve the purpose of working models for biochemical experiments going forward.
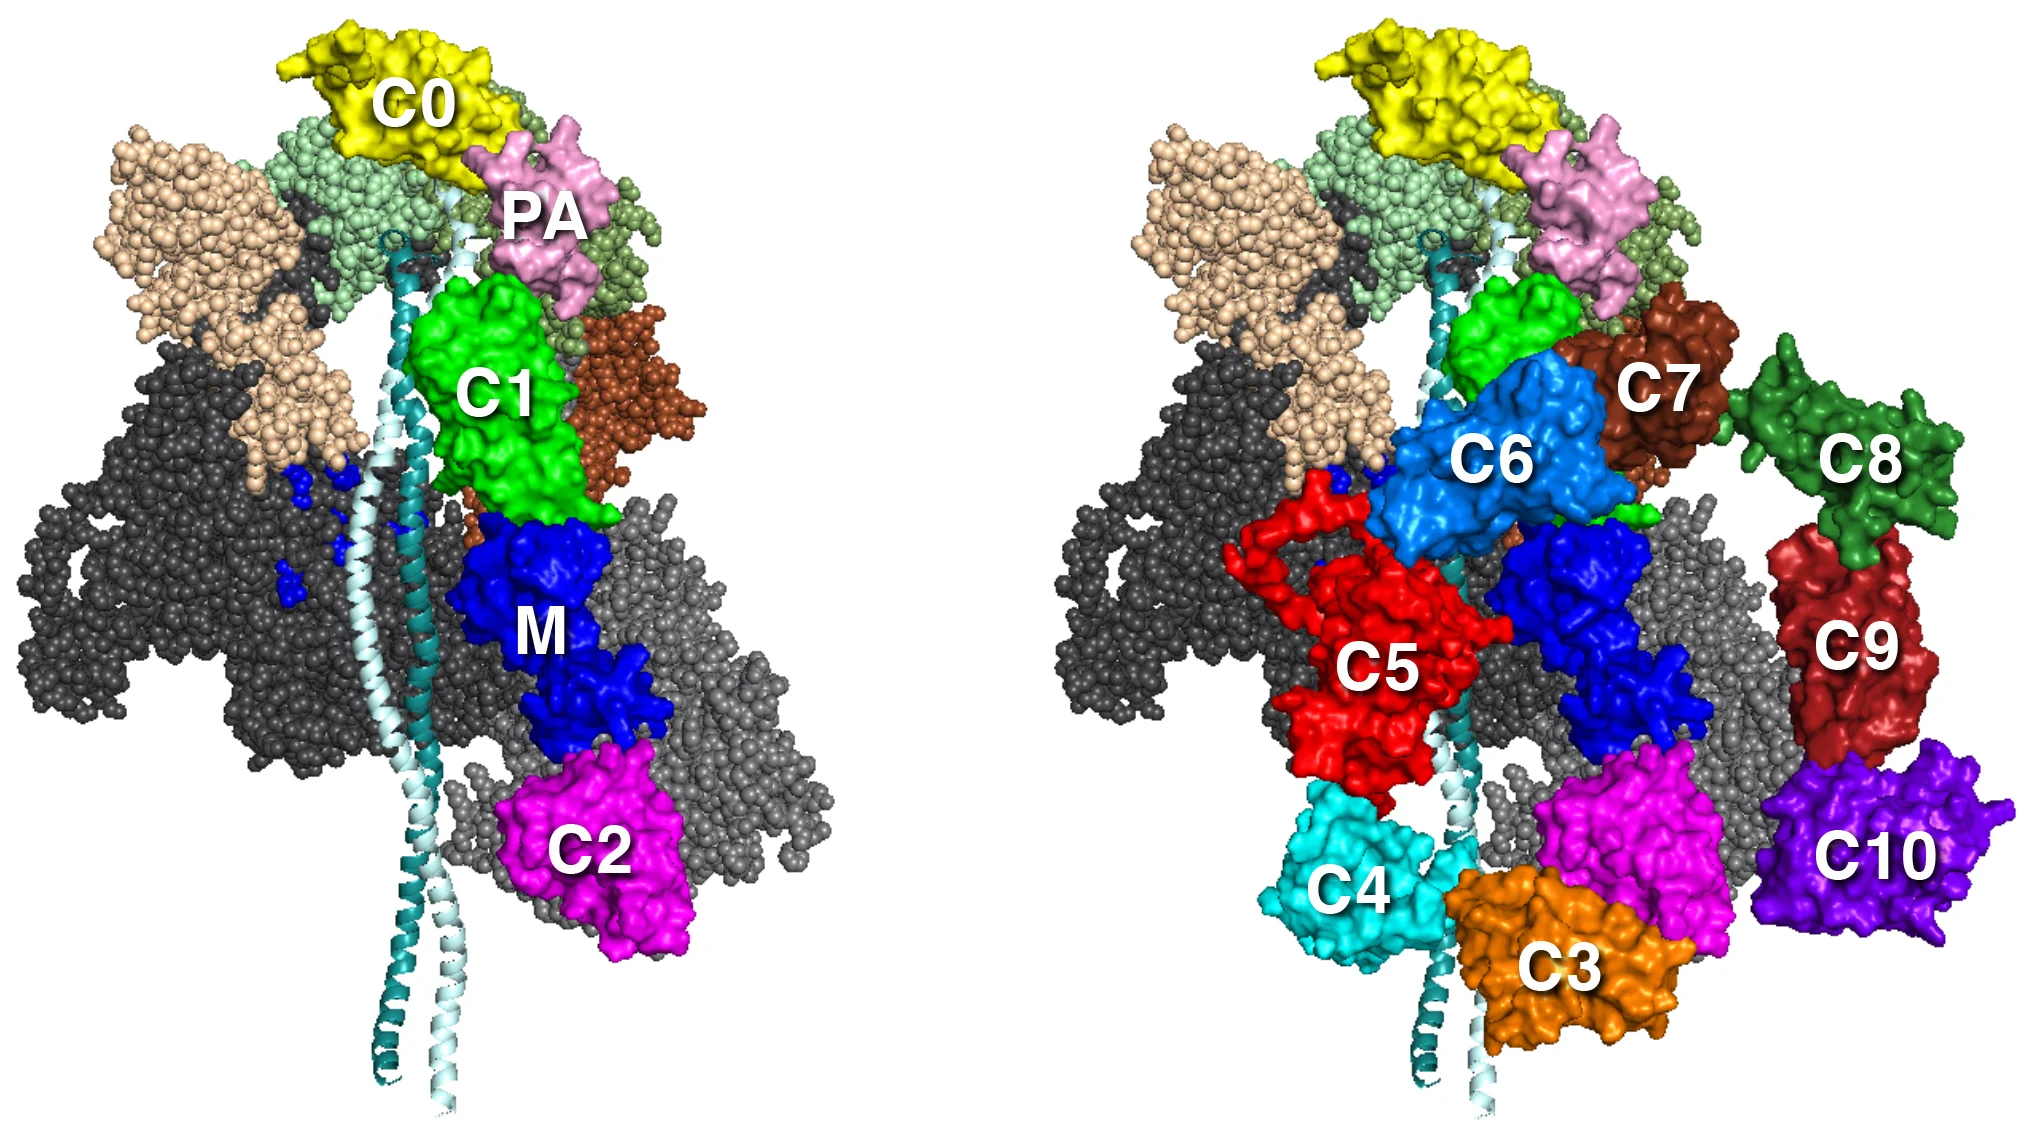
MS03C0C2 MS03C0C10v3
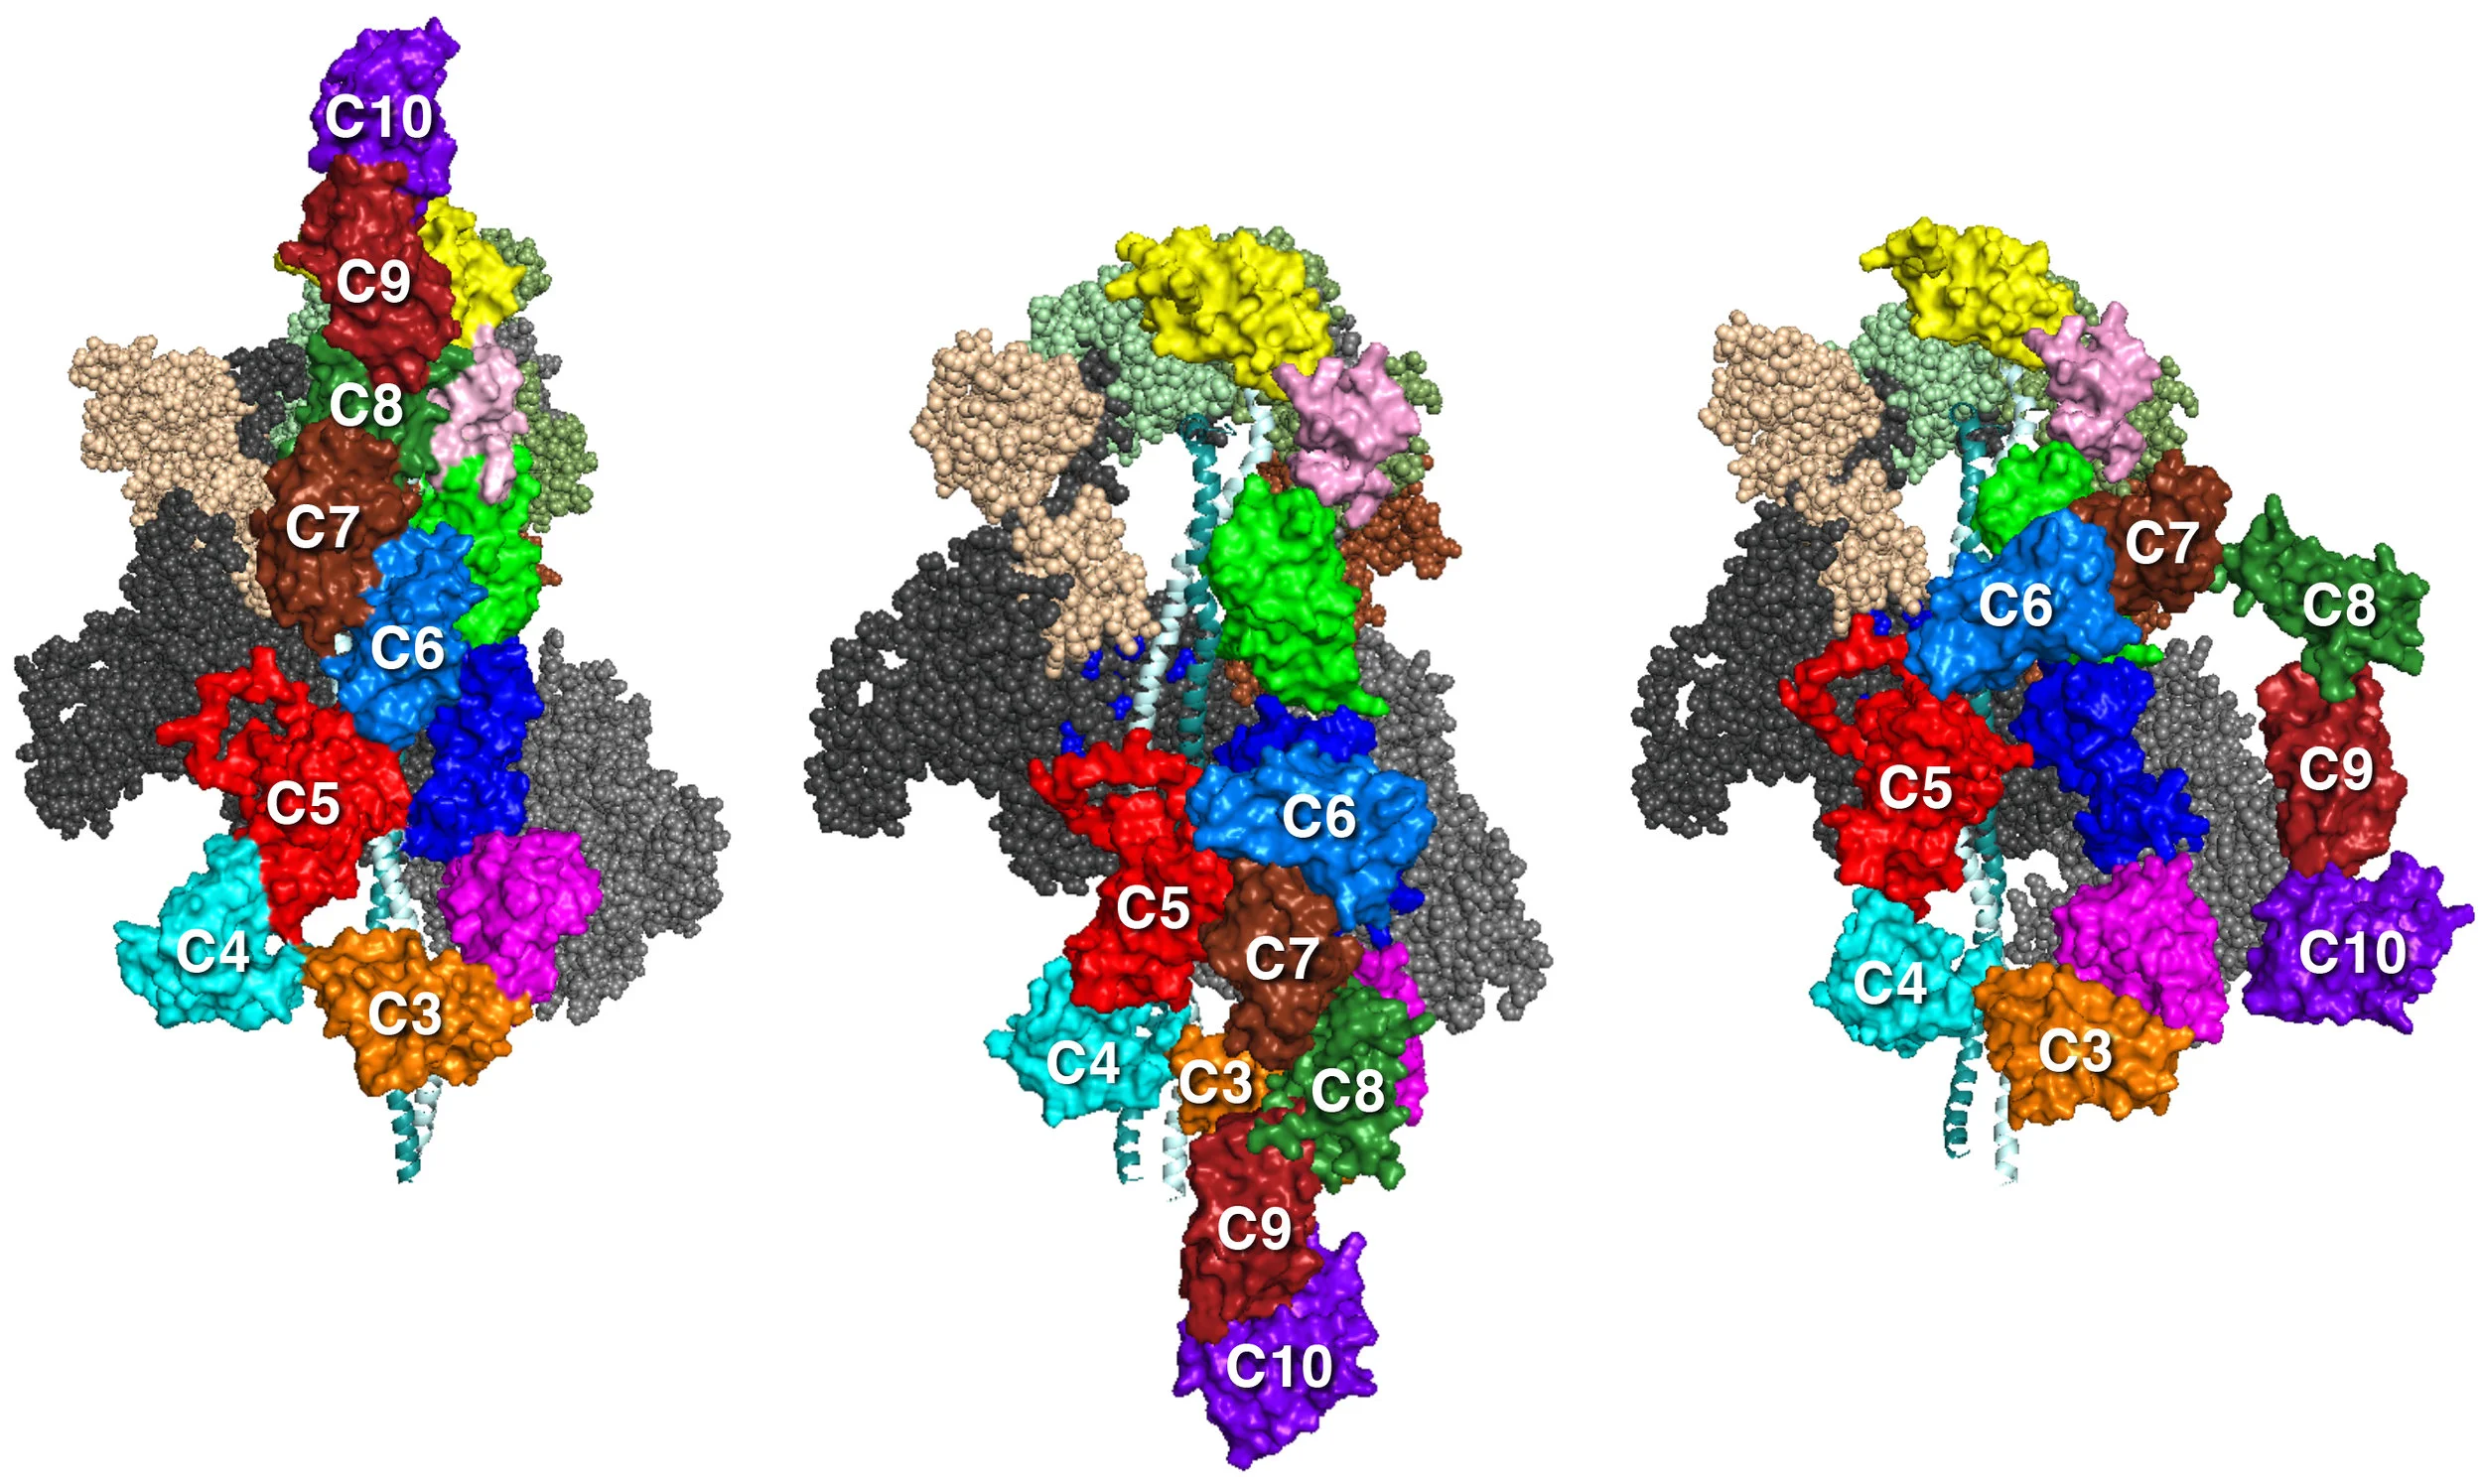
MS01C0C10 MS03C0C10v2 MS03C0C10v3
Description of homology models with MyBP-C and how they were made:
The MyBP-C domains shown are homology-modeled structures of cardiac MyBP-C domains by Dr. Margaret Sunitha. We used the protein sequence MYBPC3–Q14896 from the UniProt database (ref 1). The structures of C0, C1, C2, C3, C5, and M2 domains were obtained individually with structural homologs from the PDB files for C0 (PDB 2K1M), C1 (PDB 2AVG), C2 (PDB 1PD6), C3 (PDB 2MQ0), C5 (PDB 1GXE), and M2 (PDB 2LHU). The other domain structures (C4, C6, C7, C8, C9, C10, M1, and PA loop) were modeled independently with ab initio and template-based prediction methods (refs 2,3). All structures were energy minimized with SYBYL7.2 (Tripos) to remove potential short contacts and were validated with RAMPAGE76, which provides a detailed check of the stereochemistry of the protein structure on the basis of the Ramachandran map. The models of MyBP-C domains bound to the folded-back structure were assembled by manual placement of the MyBP-C domains onto our folded-back homology models using PyMOL. As for all of the models above, these models were also energy minimized using the YASARA force field (ref 4).
- UniProt Consortium. Update on activities at the Universal Protein Resource (UniProt) in 2013. Nucleic Acids Res 41, D43–D47 (2013).
- Xu D & Zhang Y. Ab initio protein structure assembly using continuous structure fragments and optimized knowledge-based force field. Proteins 80, 1715–1735 (2012).
- Yang J et al. The I-TASSER Suite: protein structure and function prediction. Nat Methods 12, 7–8 (2015).
- Krieger E, Joo K, Lee J, Lee J, Raman S, Thompson J, Tyka M, Baker D, Karplus K. Improving physical realism, stereochemistry, and side-chain accuracy in homology modeling: Four approaches that performed well in CASP8. Proteins. 2009;77 Suppl 9:114-22.
A comparison of our MS03 IHM state model with a new model 5TBY
Yet another homology model of the human β-cardiac myosin IHM state (5TBY) was recently created (Alamo et al. eLife 2017;6:e24634. DOI: 10.7554/eLife.24634) using the same tarantula model 3JBH as template as we used for our MS03 model. As expected, the model is very similar to our MS03 at the resolution allowed from the available 2-nm resolution EM reconstruction (see below). Differences in positions of corresponding residues within the heavy chain catalytic domain are as much as 0.2-0.8 nm, as expected given the low resolution of the reconstruction. Where the models agree best are in the regions of critical contacts discussed in Trivedi et al. Biophys Reviews 2017 and in Nag et al. Nature Structural & Molecular Biology 2017 between proximal S2 and the mesa, the interface of the blocked head and the converter of the free head, and the potential binding interfaces on the mesa of MyBP-C. As expected from the low resolution of the EM reconstruction on which these models are based, one cannot say much about side chain orientations, which are very different when comparing MS03 and 5TBY even though they were created using the same template. Large differences are seen in the positions of the light chains. The positions of the ELCs are reasonably similar, although differences in identical residue positions are up to nearly 2 nm. The RLC positions are very different and particularly difficult to place with any accuracy probably due to the need to alter the regulatory light chain binding regions of the heavy chain to accommodate the extreme bending back of the S1 heads about the S1-S2 junction.
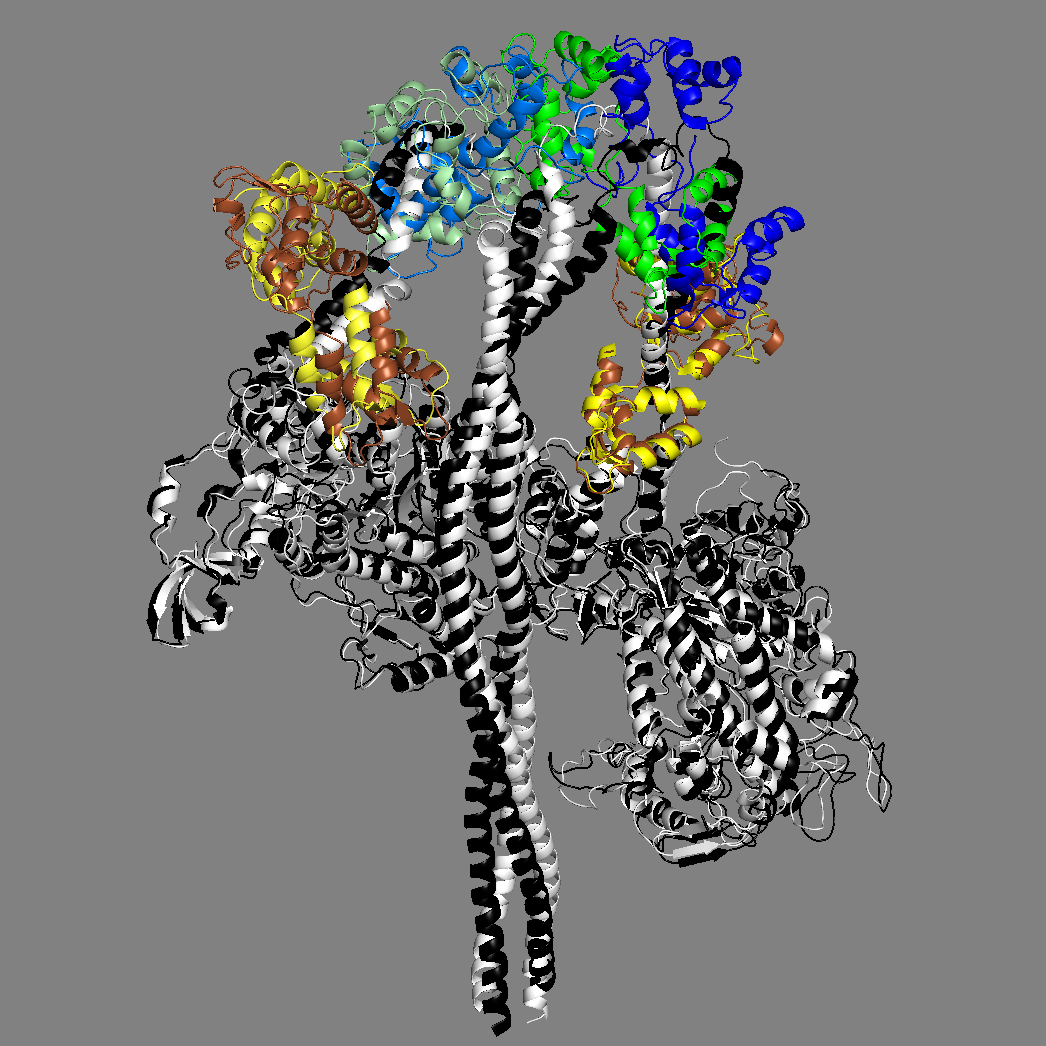
MS03: HC white, ELCs brown, RLCs green 5TBY: HC black, ELCs yellow, RLCs blue
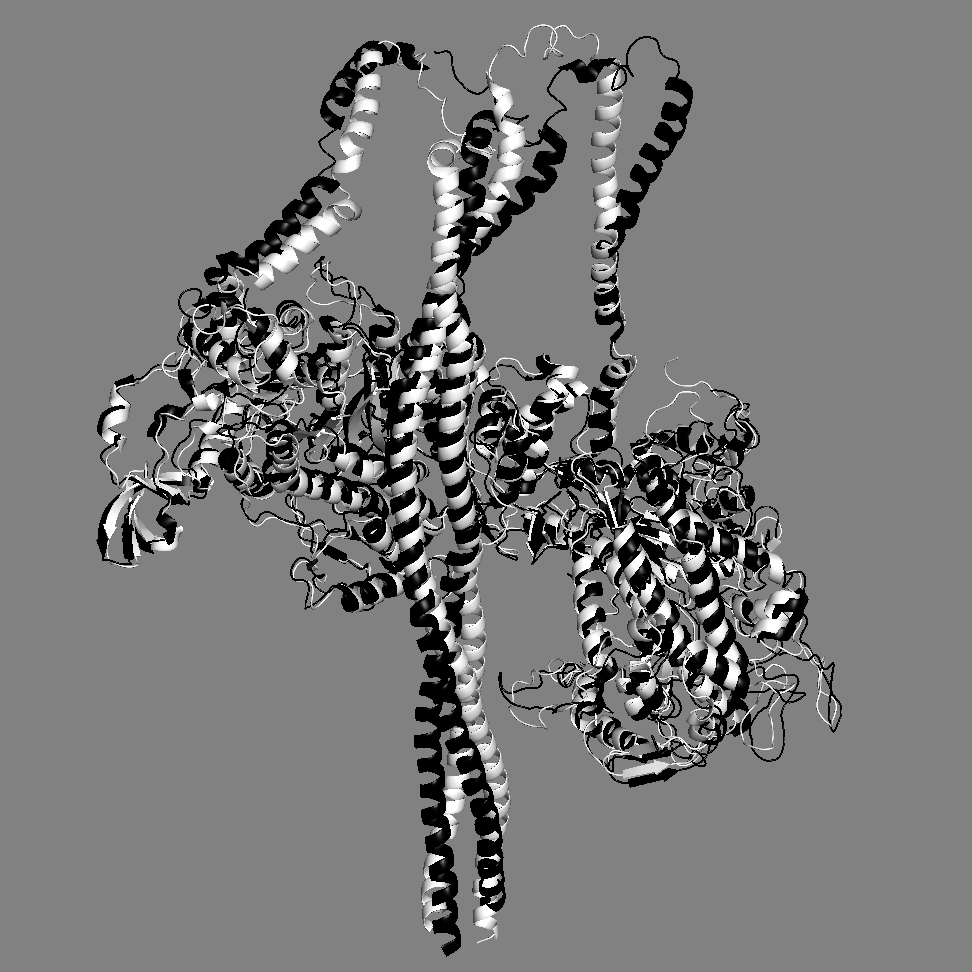
Same as above without LCs
same as above ELCs only
Same as above RLCs only
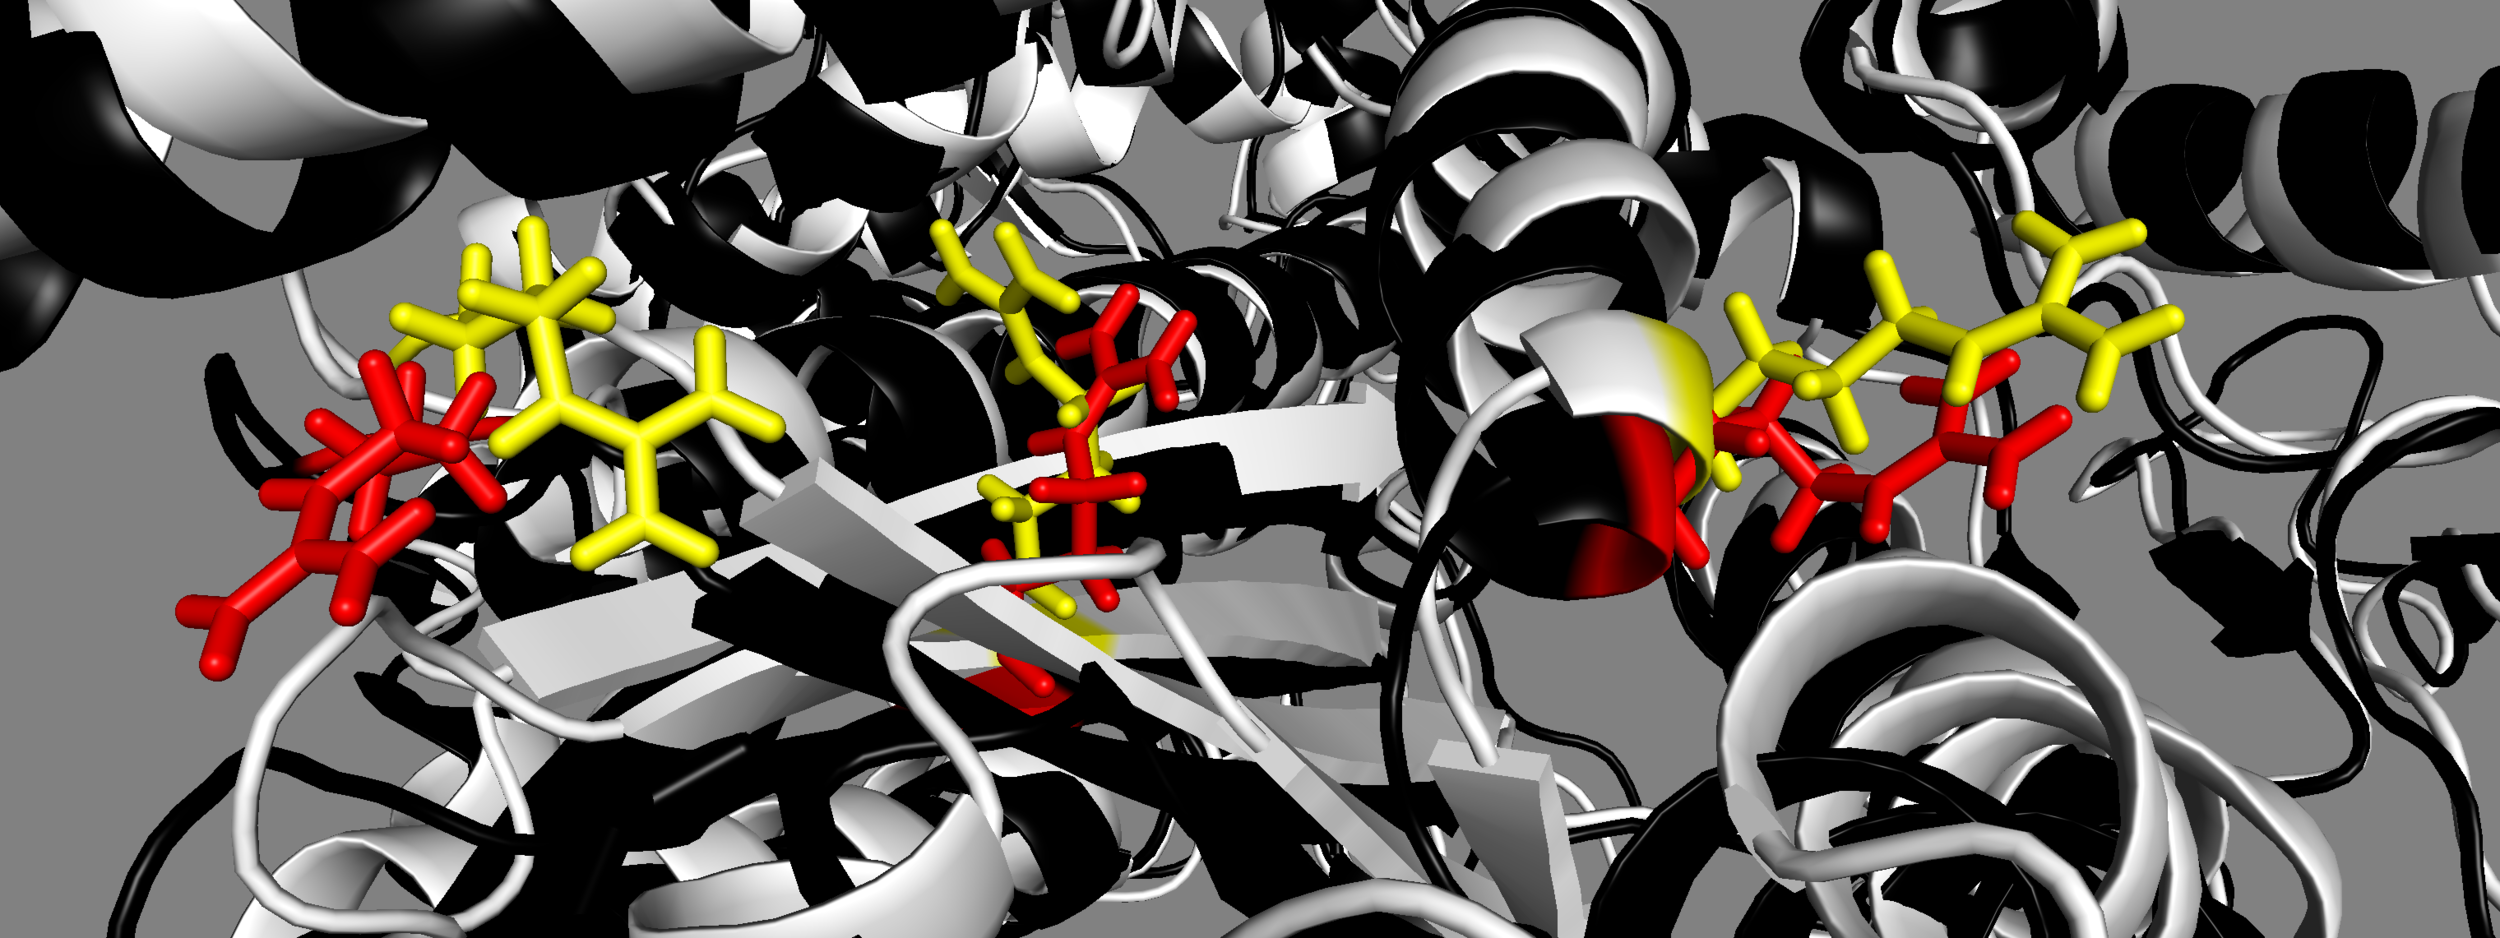
MS03: yellow 5TBY: red From left to right, mesa residues Arg453, Arg249, Arg663
Note different orientations of side chains for MS03 and 5TBY